2026
Syncura
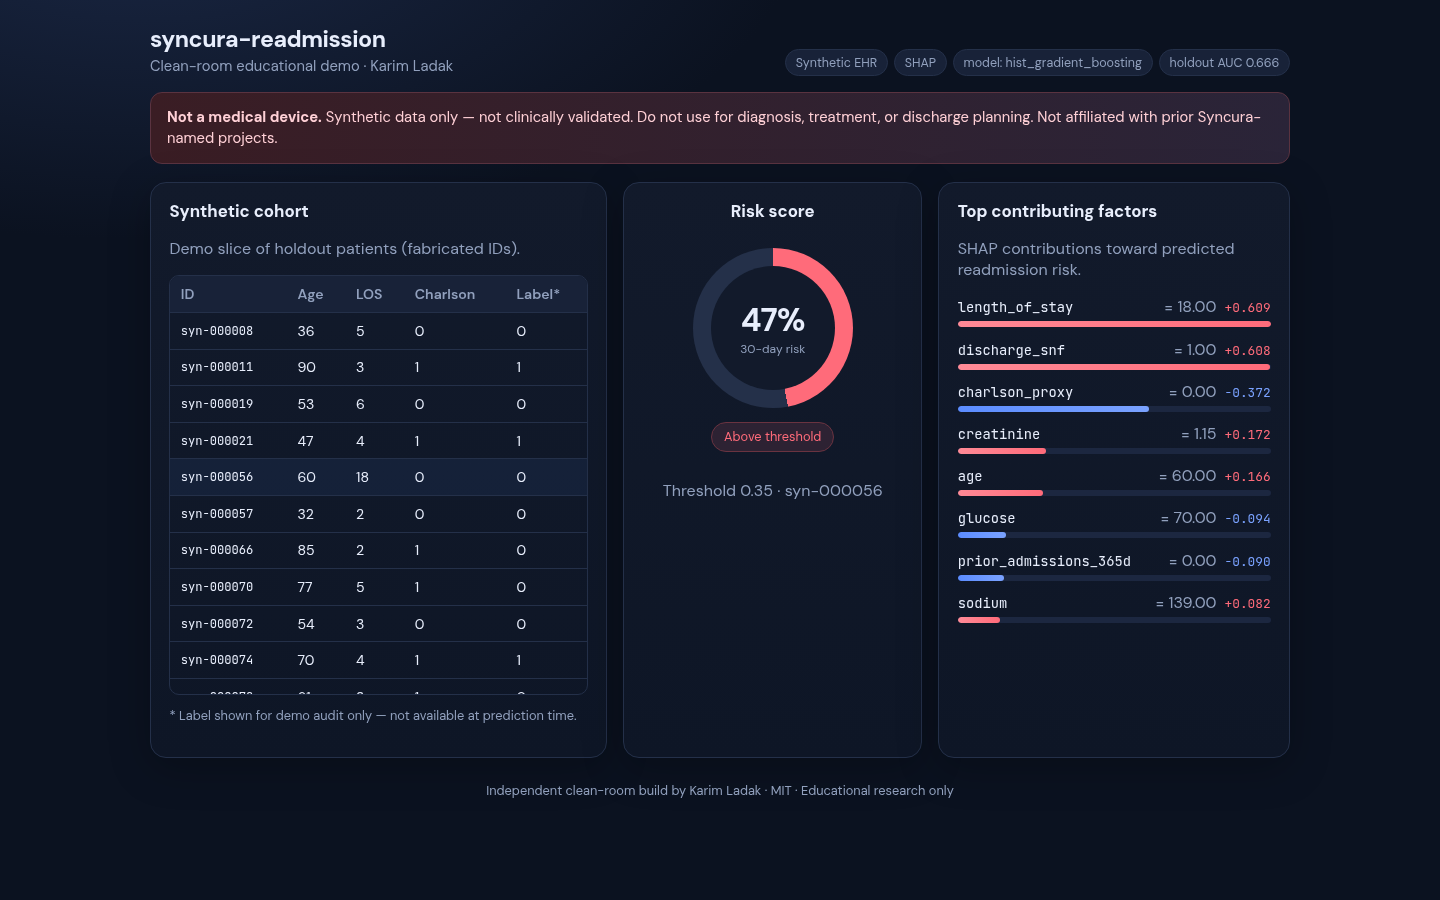
Estimates 30-day readmission risk and shows which patient features contributed to each score.
- Role
- Sole engineer
- Stack
- Python, scikit-learn, SHAP, FastAPI, React
The problem
A readmission score is more useful when the person reviewing it can see what contributed to the prediction. Syncura places feature contributions beside each score and shows the threshold used to classify risk.
Decisions
Use a model with per-prediction explanations
The dashboard uses gradient boosting because its predictions can be broken down into feature contributions. Logistic regression performs slightly better on the synthetic dataset, but does not provide the same explanation used by the interface.
TradeoffThe performance difference is small on this dataset and may not hold on different data.
Limits
- The dataset contains 4,000 synthetic patients. No clinical data is used.
- Model performance is limited by the synthetic generator and should not be interpreted as clinical performance.